

Visualizing Science
Faith Singer
Good Flow, Clean Water
Maximizing flow for clean drinking water
Only about 1.2 percent of the Earth's water can be used as drinking water. The World Health Organization predicts that by 2025 over one-half of the world’s population will be living in water-distressed areas. New sources of clean water are needed to sustain life.
Highly engineered membranes as thin as a human hair have shown promise for desalinization. But experimentally determining which aspects of the membranes most affect membrane performance has been a challenge.
A team of academic and industry researchers found that creating a uniform membrane down to the nanoscale is crucial for maximizing the performance of reverse-osmosis water-filtration membranes. Their discovery was published in the journal Science in January 2021.
Using Penn State's transmission electron microscope measurements of four polymer membranes used for water desalination, Iowa State engineers used TACC supercomputers to predict water flow through 3D models of the membranes, allowing detailed analysis of why certain membranes performed better than others.
The conclusion? The key to better desalination lies in manufacturing highly uniform membranes, promoting water flow without sacrificing salt removal.
Visualization Behind the Image
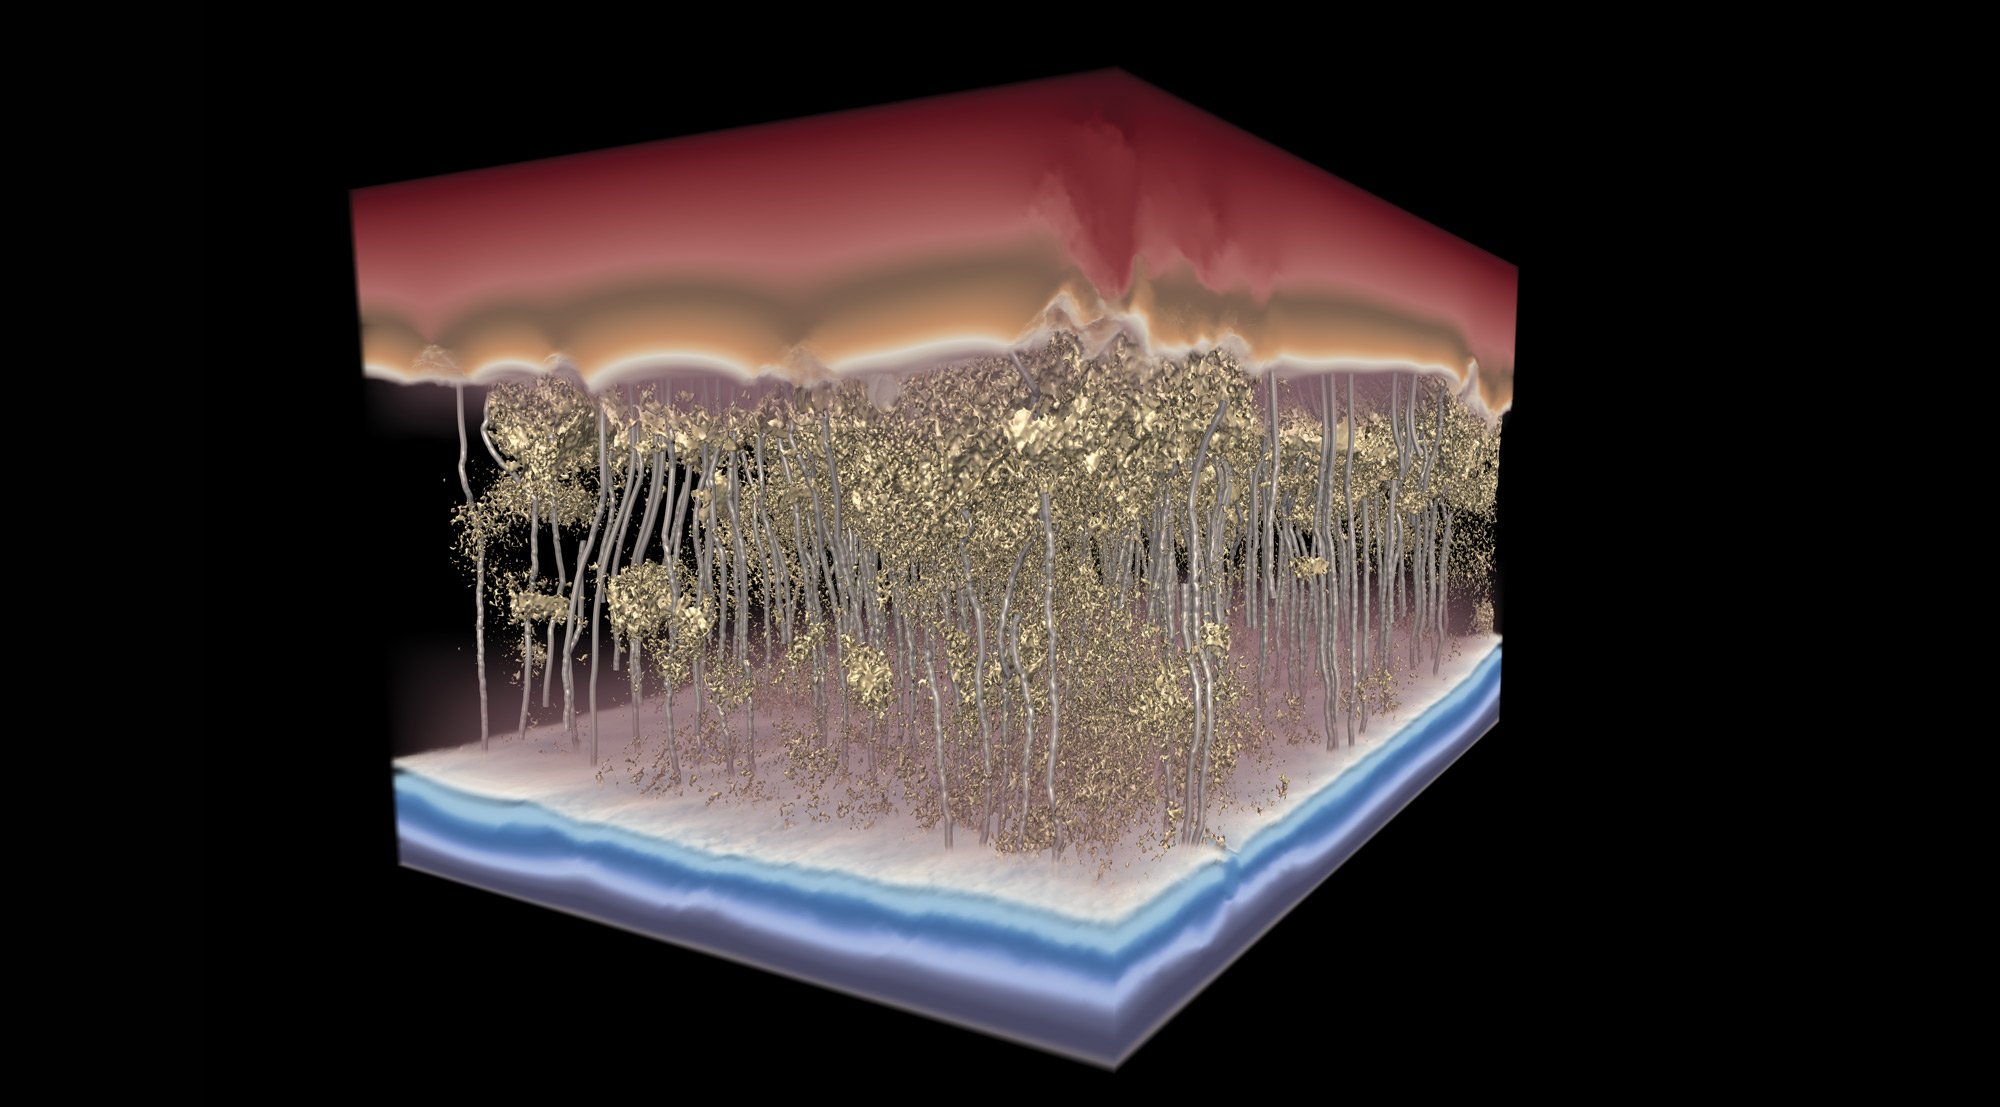
This 3D visualization of a polymer desalination membrane shows water — the silver channels moving from top to bottom — avoiding dense spots in the membrane that slow flow.
The image appeared on the cover of Science. It was created by Greg Foss, a visualization expert and artist at TACC, in collaboration with the Iowa State researchers, using Kitware’s ParaView visualization software with Intel’s OSPRay ray tracer, part of the Intel oneAPI rendering toolkit.
Data: Baskar Ganapathysubramanian, Iowa State University
Visualization: Greg Foss, TACC
The paper appeared in Science, January 2021. The visualization was featured on the cover.