

Visualizing Science
Sean Cunningham
Finding Faults
The complex dynamics of multi-fault earthquake systems
Separated by 34 hours, the 2019 Ridgecrest earthquake sequence in the Mojave Desert was caused by ruptures in distinct but nearby faults. The earthquakes left researchers questioning the nature of how and why they occurred, and why there was such a large span of time between them.
Geophysical and geological measurements at the surface provide valuable information on earthquakes, but the true action happens beneath the surface hidden from view.
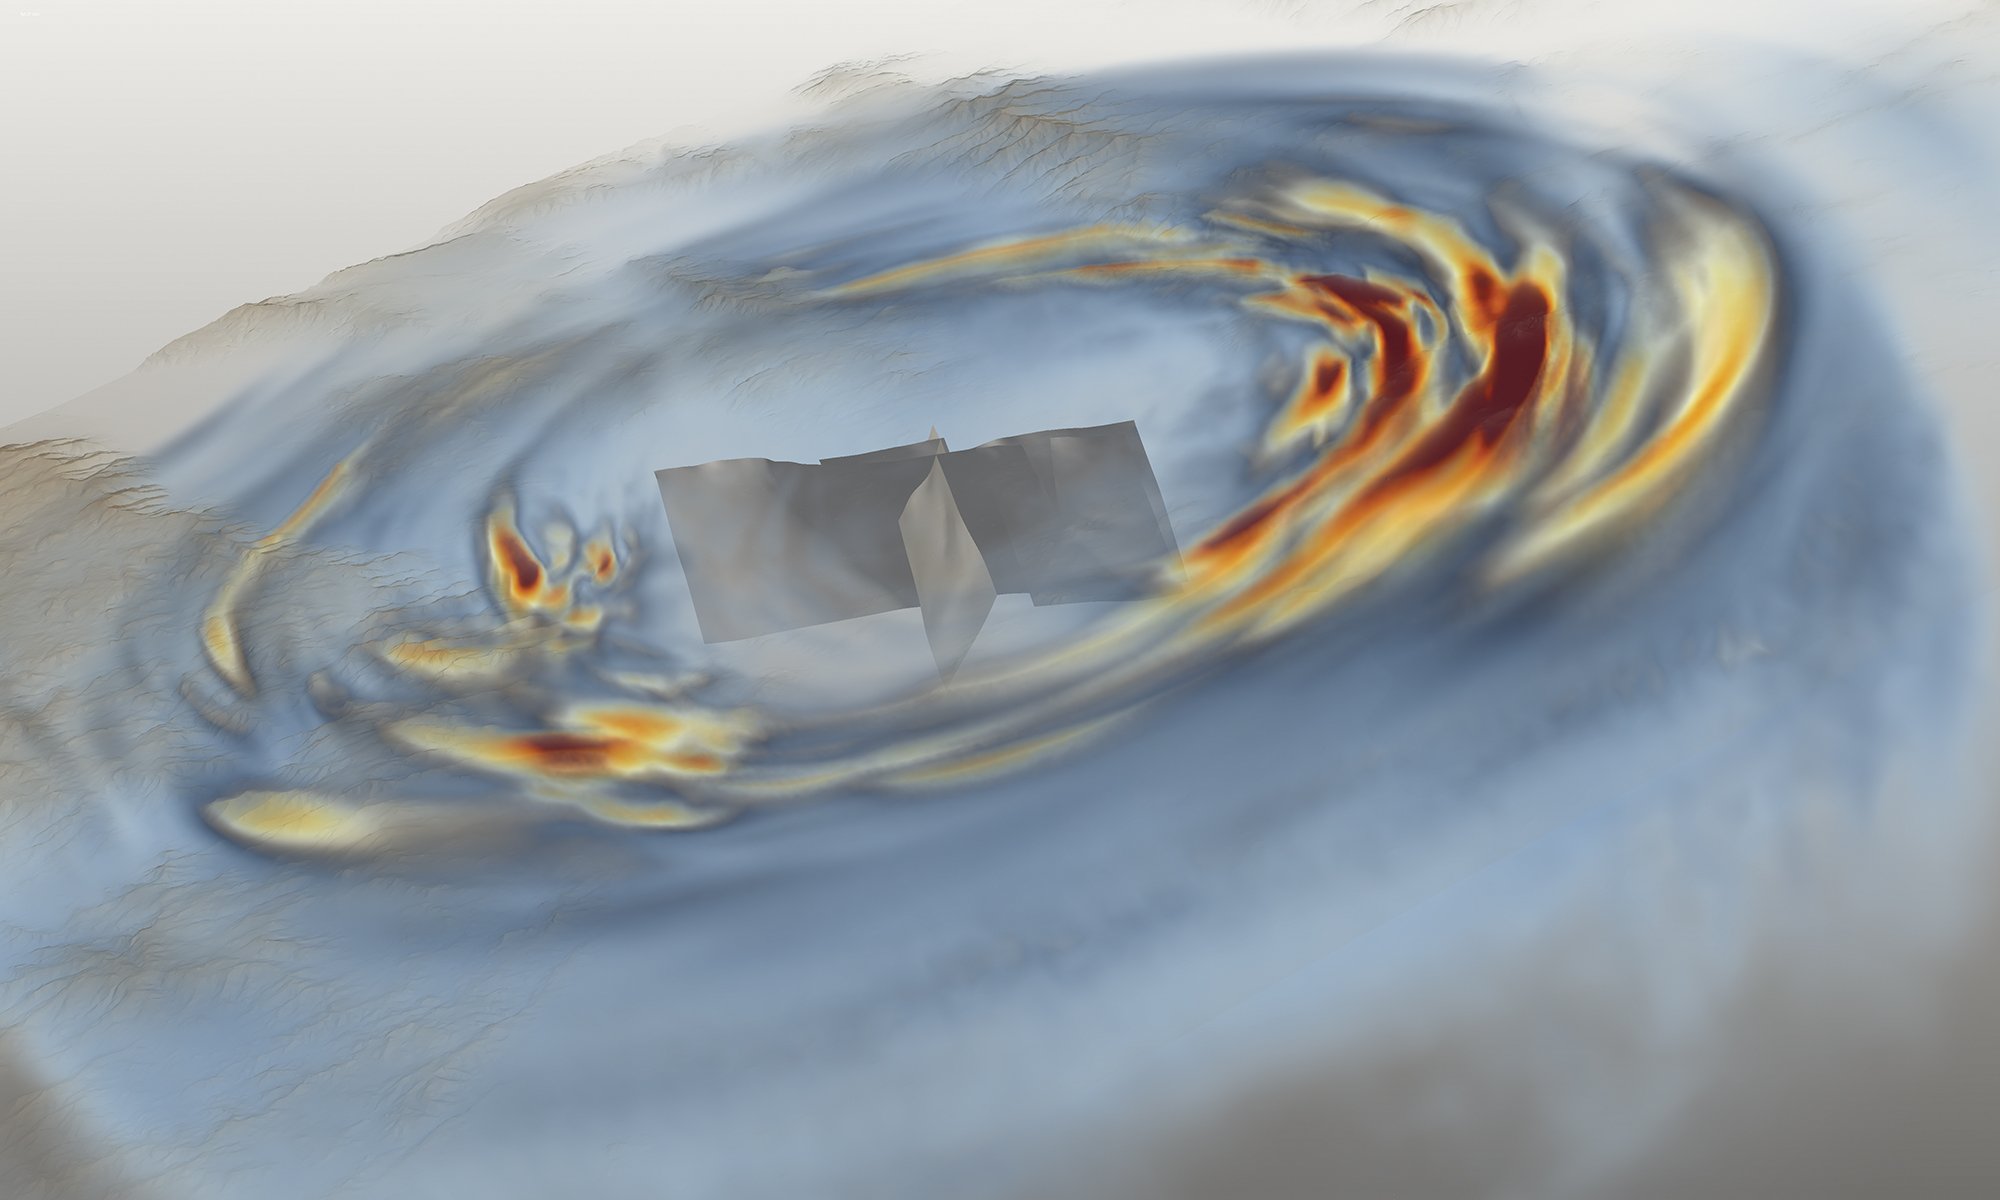
This is where the power of computer simulations shines — they enable us to understand the unseen tectonic processes beneath us. TACC visualization experts Greg Abram and Francesca Samsel constructed a 3D visualization of the Ridgecrest earthquakes to help researchers understand the underlying dynamics of their ruptures.
The animation shows the shifting shear stresses across the fault system during the two earthquakes. The first earthquake takes the shape of a narrow slip pulse and causes a significant accumulation of shear stress on a separate fault segment, which reactivates the main shock 34 hours later.
"Powerful visualization is crucial for physics-based interpretation of the big data now becoming available and has a transformative impact on future geohazard mitigation," said Alice-Agnes Gabriel, of Scripps Institution of Oceanography, UC San Diego.
This work is partially supported by NSF through the CSA award (OAC-2139536); NSF grant No. EAR-2121568; European Union’s Horizon 2020 Research and Innovation Programme grant No. 852992; Horizon Europe grants No. 101093038, 101058129, and 101058518; NASA grant No. 80NSSC20K0495; Southern California Earthquake Center awards 22135, 23121.