Visualizing Science
Aaron Dubrow
Related Articles
Expanding the Visual
TACC improves the state-of-the-art in scientific visualization

Scientists’ eyes are their most powerful data processing tool. Scientific visualizations — whether 3D animations of cells in action or heatmaps of traffic sensor data — can spark insights and identify patterns that may be overlooked by statistical methods alone.
Throughout its 20 year history, TACC has helped scientists see their data better. The center’s visualization team architects custom systems, collaborates on visualizations with researchers, and develops software tools for the broader computational community.

For many years, TACC designed its visualization systems separately from its compute systems. “The status quo was to treat visualization as done after the fact on a local machine,” said Paul Navrátil, director of Visualization at TACC.
As data grew too large to download and required more processing capability than a workstation or laptop could provide, TACC “started building vis-specific machines in the data center to simplify, or eliminate, data movement and to provide users more powerful machines for analysis,” Navrátil said.
TACC’s first stand-alone vis system was Maverick in 2004. This was followed by Spur (2009), Longhorn (2010) and Maverick (2012).
But as datasets ballooned, storing and moving data, even within a data center, became a limit for analysis. Increasingly, visualizations needed to be performed on the same machine where the data was produced.
Working with partners — including Intel, and visualization software companies, Kitware and Intelligent Light — TACC has developed a suite of open-source packages that can render and visualize efficiently on supercomputers regardless of their architecture. They call this paradigm Software-Defined Visualization.
“We’re creating the ability to render pixels independent of the underlying hardware,” said Navrátil. “Every node of our HPC machines becomes a vis node.”
What’s the Situ
Co-locating visualization and modeling capabilities on a single system helps, but in many cases datasets still can’t be written to disk efficiently at full velocity, where every step is saved; or full resolution, where the entire dataset is saved at every time step. That’s where in situ (“in place”) visualization techniques come in. In situ visualization addresses the data bottleneck by either performing the analysis while the data is available in memory from the simulation, or down-sampling the data to be stored to disk for post hoc (after the event) analysis at a coarser resolution.
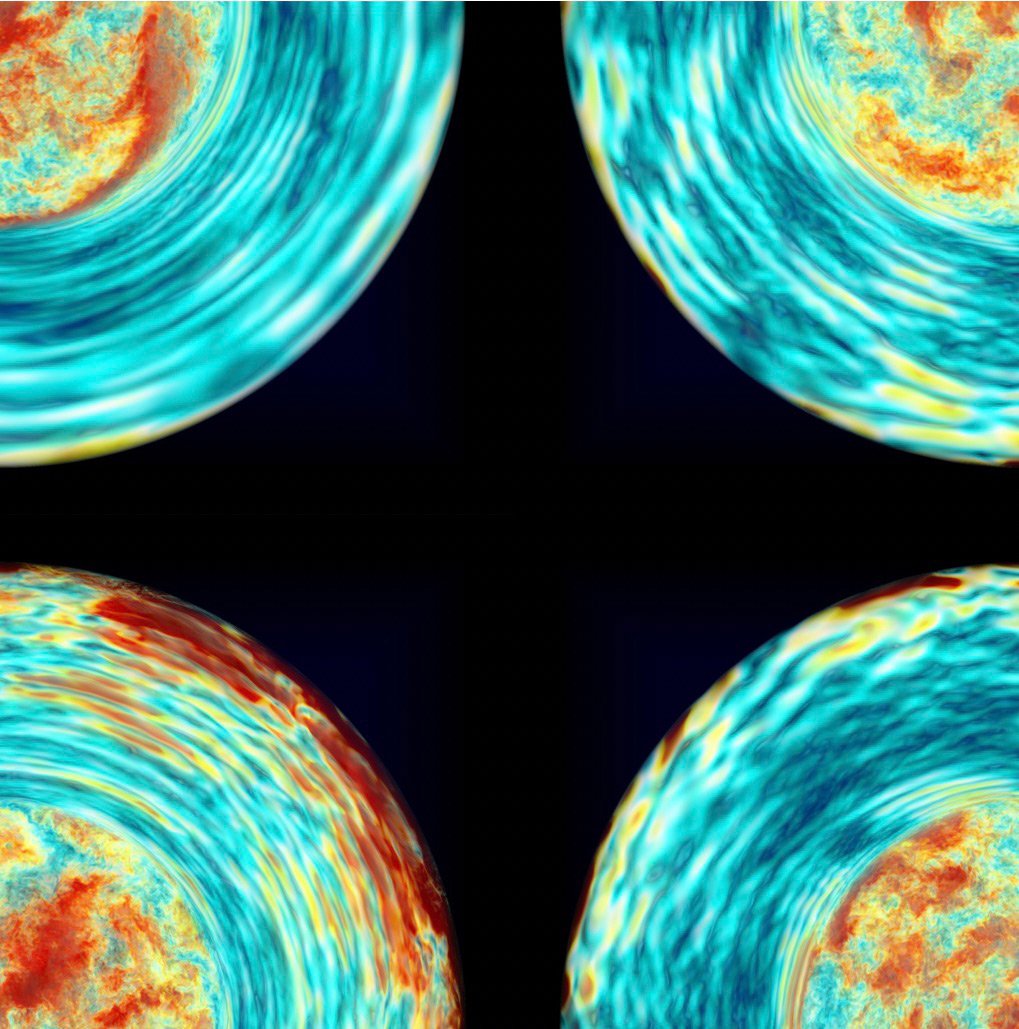
Alyson Brooks, professor of astrophysics at Rutgers University, used TACC’s Frontera system to create the highest-ever resolution simulations of a Milky Way-like galaxy — and, simultaneously, to visualize these simulations.

The frames for the movie were created on-the-fly during her team’s simulation runs. They identified particles that they wanted to center their movie on, then the software put a mock "camera" at a desired distance and angle relative to those particles, and created a "photo" at each simulation step. They later strung together the output images into a movie.
“The visualizations were done on Frontera because the code was run on Frontera,” Brooks said.

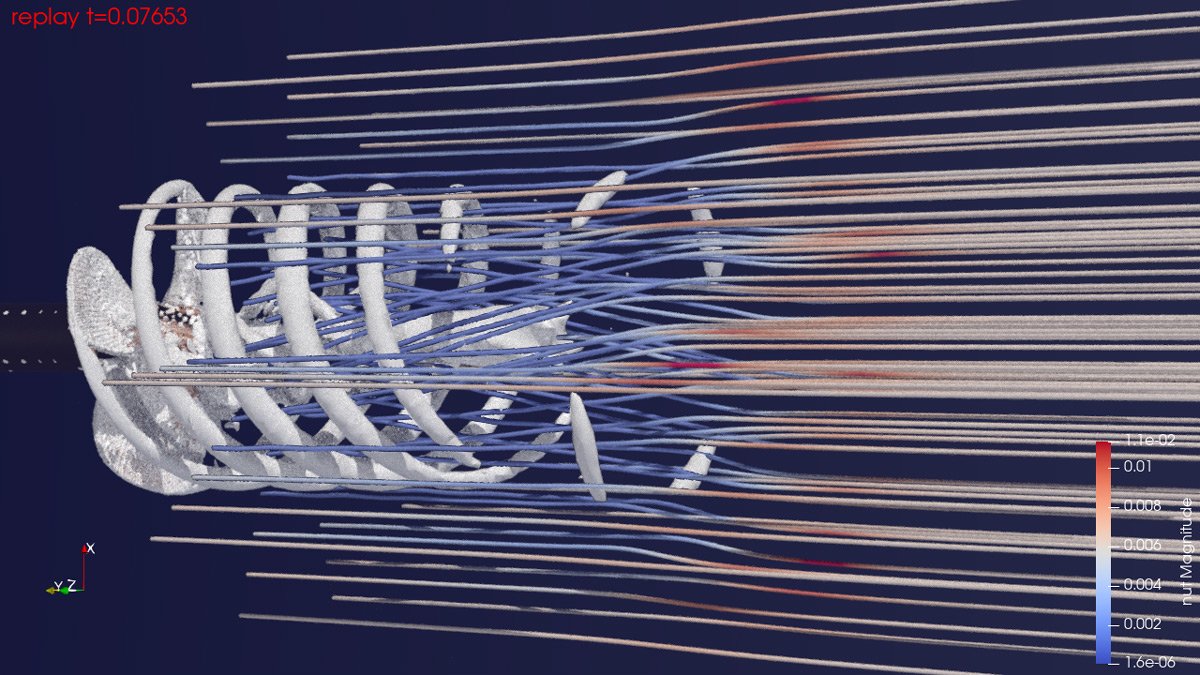
In the May/June issue of IEEE Computing in Science and Engineering, David DeMarle of Intel, and Andrew C. Bauer of the U.S. Army Engineering Research and Development Center described efforts using Frontera to test in situ visualizations of turbulence from a rotating propeller.
“Data management is listed as one of the top ten exascale challenges,” they wrote. “One method for reducing the data deluge in scientific workflows is through the use of in situ analysis and visualization.”
In this case, the researchers used temporal buffers, which temporarily store data in memory for possible later analysis. “The benefit of temporal buffering in this situation,” they wrote, “is access to potentially important computed data that would otherwise have been lost.”
As the Ray Flies
A final way that TACC is improving the state-of-the-art in visualization is through the development of more efficient, and platform-agnostic, tools for ray tracing, a rendering technique that creates photorealistic effects by better capturing the physics of light.
The impact of this work goes beyond the scientific arena. TACC contributed to the Intel Embree Ray Tracing Kernel, a software tool that won a Scientific and Technical Academy Award in 2021. The Academy cited Embree’s “industry-leading ray tracing for geometric rendering as a contributing innovation in the moviemaking process.”
Ray tracing, in situ and software-defined visualization software are available on nearly all of TACC’s systems, including Frontera and Stampede2. Researchers use it to create rich, interpretable, and shareable versions of their work on the same machine, or the same computing ecosystem, where they run their simulations.
“By developing, combining, and making these tools available on our systems, we’re allowing our researchers to visualize their data in more familiar and meaningful ways, enabling better communication of science to the world,” Navrátil said.

